
Planning your rollout
A practical path from first pilot to multi-site deployment, step by step.

The difference between a successful multi-site deployment and a stalled pilot is rarely the technology. It is the plan: what you measure, when you scale, and who owns the result. This guide describes the path we use with customers, Assessment, Pilot, Roll-out, Optimisation, and what makes each phase work.
Phase 1: Assessment
Before any hardware, map the physical supply flows: what items, where, who takes them, how they are replenished, and what they cost today, including the costs nobody tracks: search time, emergency purchases, audit labour, shrinkage. The output is a prioritised list of supply points ranked by pain and by measurability, and a baseline. The baseline is the step most rollouts skip and later regret: without today's numbers, the pilot cannot prove anything.
Phase 2: Pilot
Pick one or two supply points where pain is high and results will be visible within a quarter: the tool crib with the worst losses, the site with the highest shrinkage. Deploy the matching hardware, connect it to Instant Cockpit, and change nothing else.
Three rules keep pilots honest. One quarter, fixed metrics: loss, stockouts, labour hours, accuracy, agreed before the pilot starts. Real users, real flow: no hand-picked teams; the pilot must survive the night shift. And watch adoption, not just numbers: if people route around the system, find out why now, not at site 30.
The baseline is the step most rollouts skip and later regret.
Phase 3: Roll-out
Scale in waves, not big bangs. Group sites by profile (size, layout, assortment), template the configuration from the pilot, and commission each wave remotely through Instant Cockpit. Integration with ERP and procurement, done once at pilot stage, replicates across waves.
What makes waves fast: a named owner per wave on the customer side; templated product data, user groups, and stock rules; remote configuration and diagnostics, so site visits are for installation, not administration; and a short feedback loop, where each wave's data tunes the next.
Phase 4: Optimisation
Go-live is the start of the return, not the end of the project. With live consumption data flowing, par levels and assortments adjust from measured usage per site, replenishment shifts from calendar to consumption, and usage analytics reshape purchasing: what is actually needed, what sits idle.
ISSA and Instant Cockpit reporting put answers in the team's hands, and software updates keep adding capability to hardware already on the floor. Review quarterly against the baseline from Phase 1: the same metrics, now trending.
The two failure modes to avoid
Scaling before measuring: a pilot without a baseline produces anecdotes, and anecdotes do not survive budget meetings. And piloting forever: if the quarter's numbers are good, the next wave should already be scheduled. Momentum is part of the plan.
Guide: Choosing the right automation
Map your operational challenges to the right hardware formats.
Key takeaways
Related articles
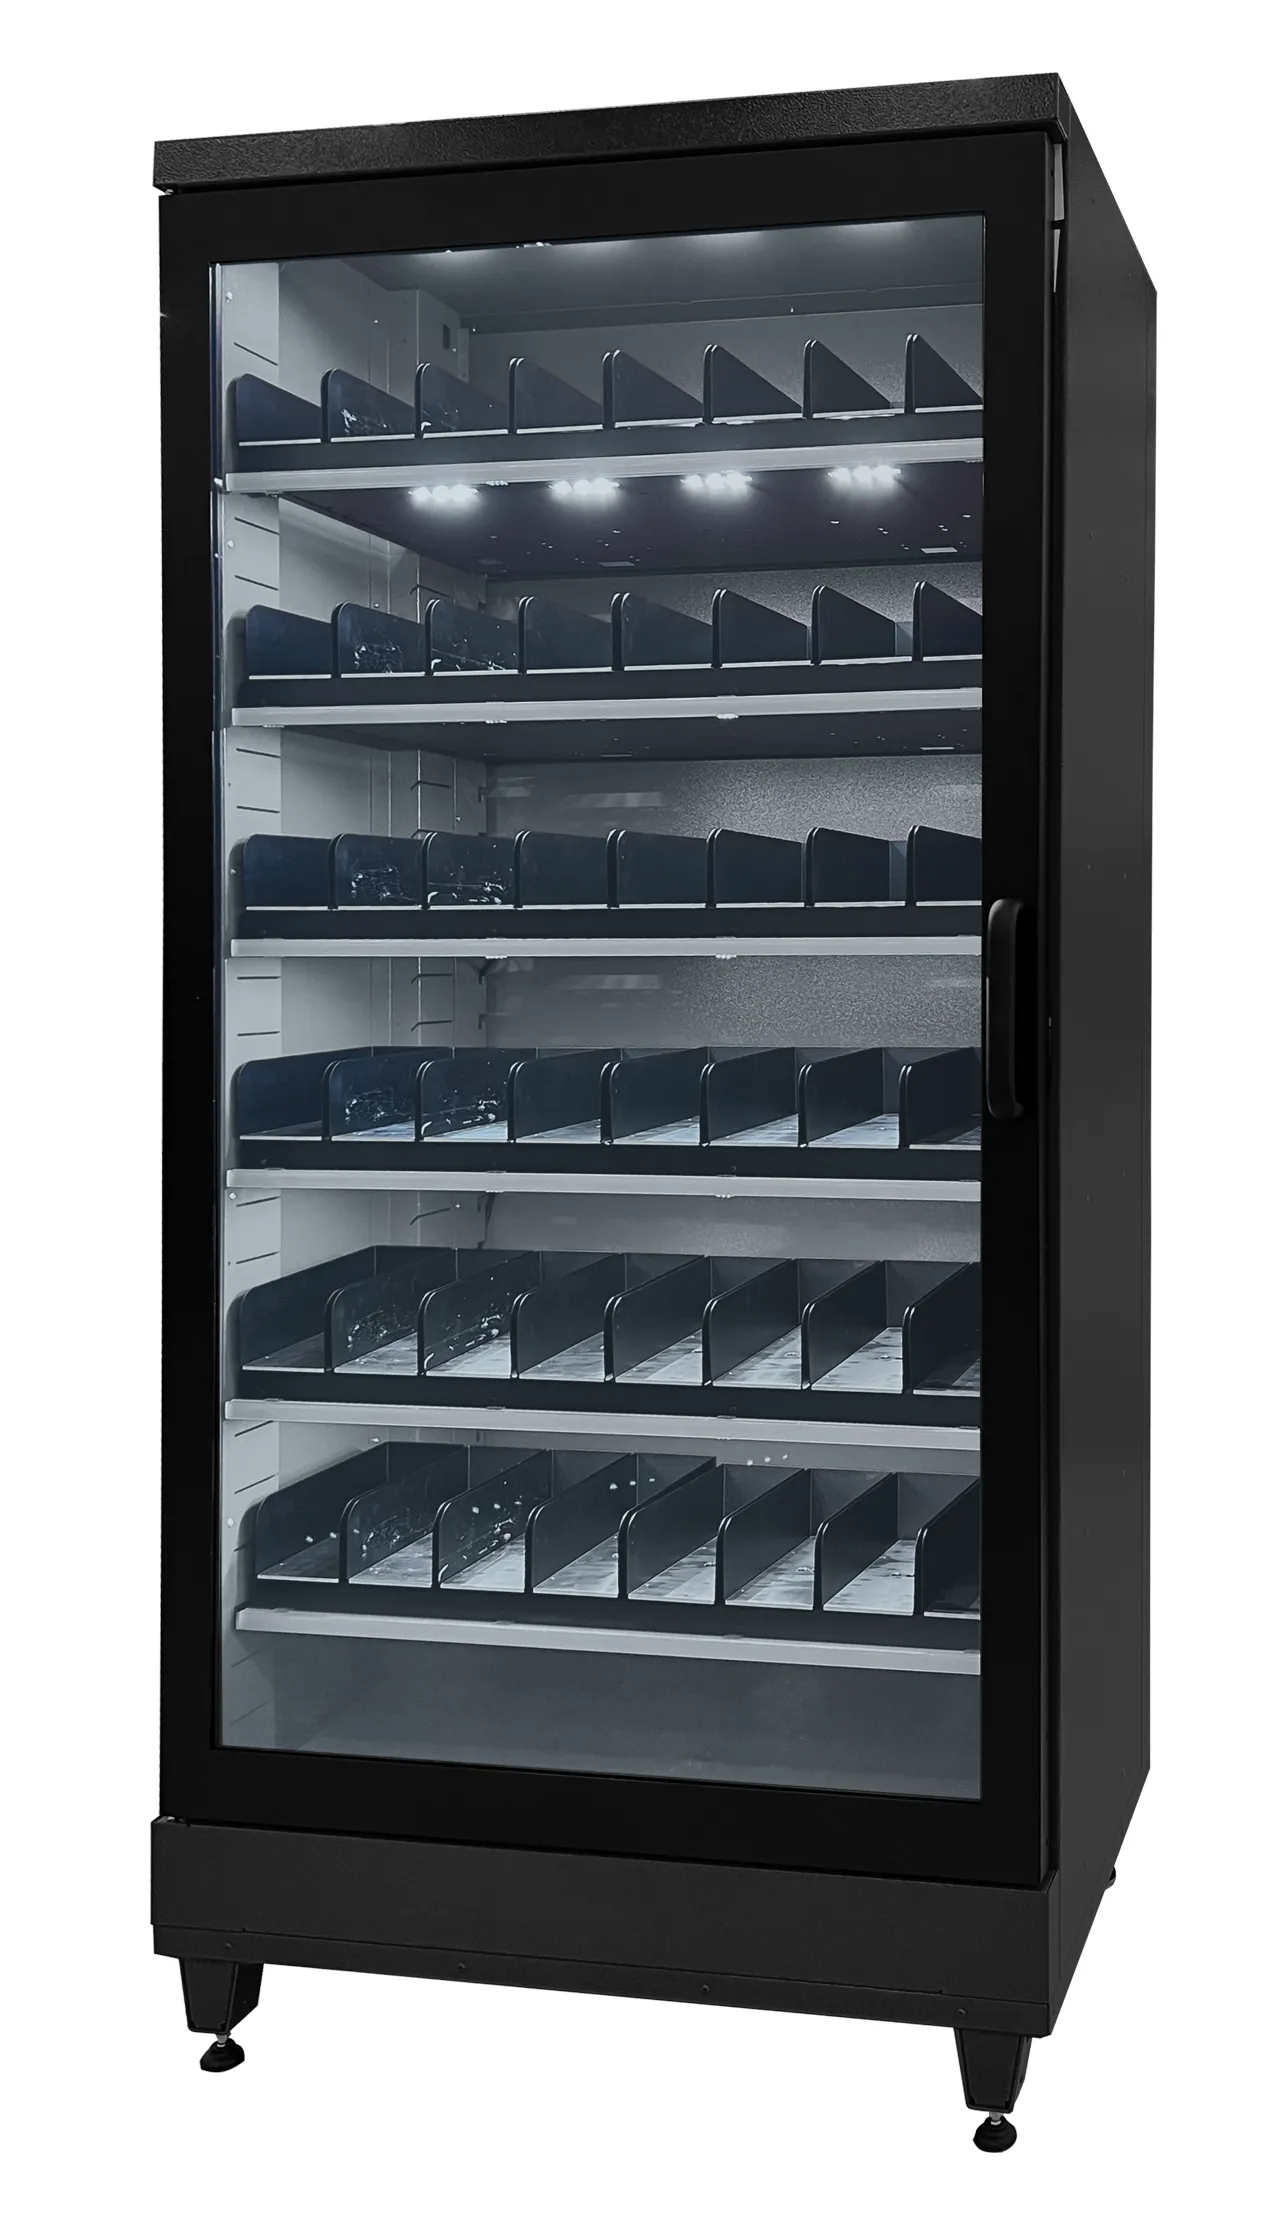 Comparison guide
Choosing the right automation
Compare smart cabinets, coolers, shelving, and stores against your operational needs.
Read more →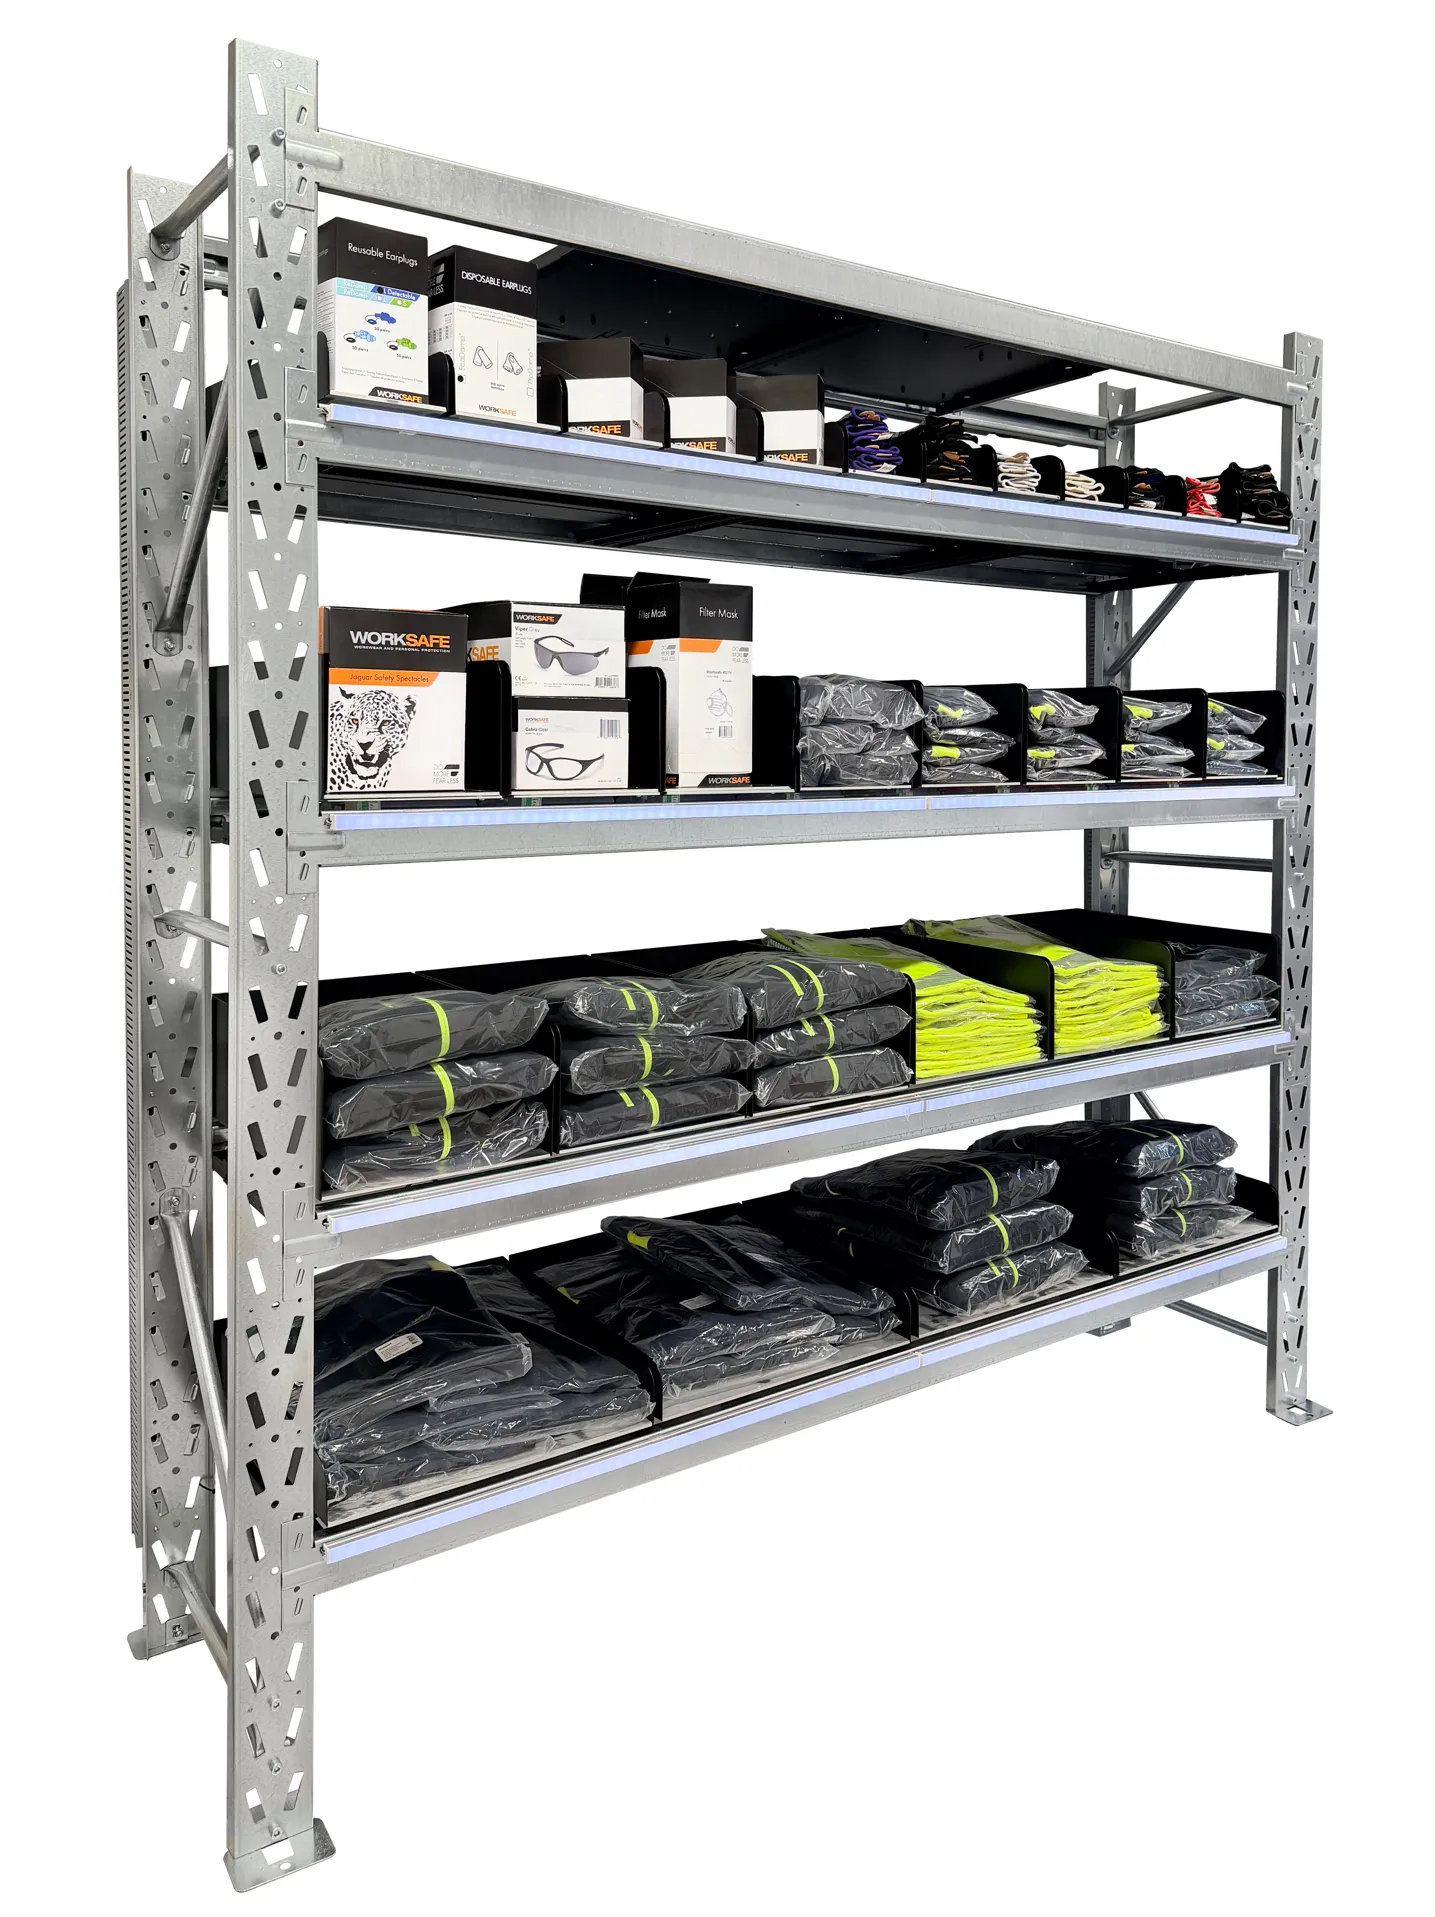 Cornerstone guide
What are smart industrial inventory systems?
A complete guide to the hardware, software, and integrations that power modern supply automation.
Read more →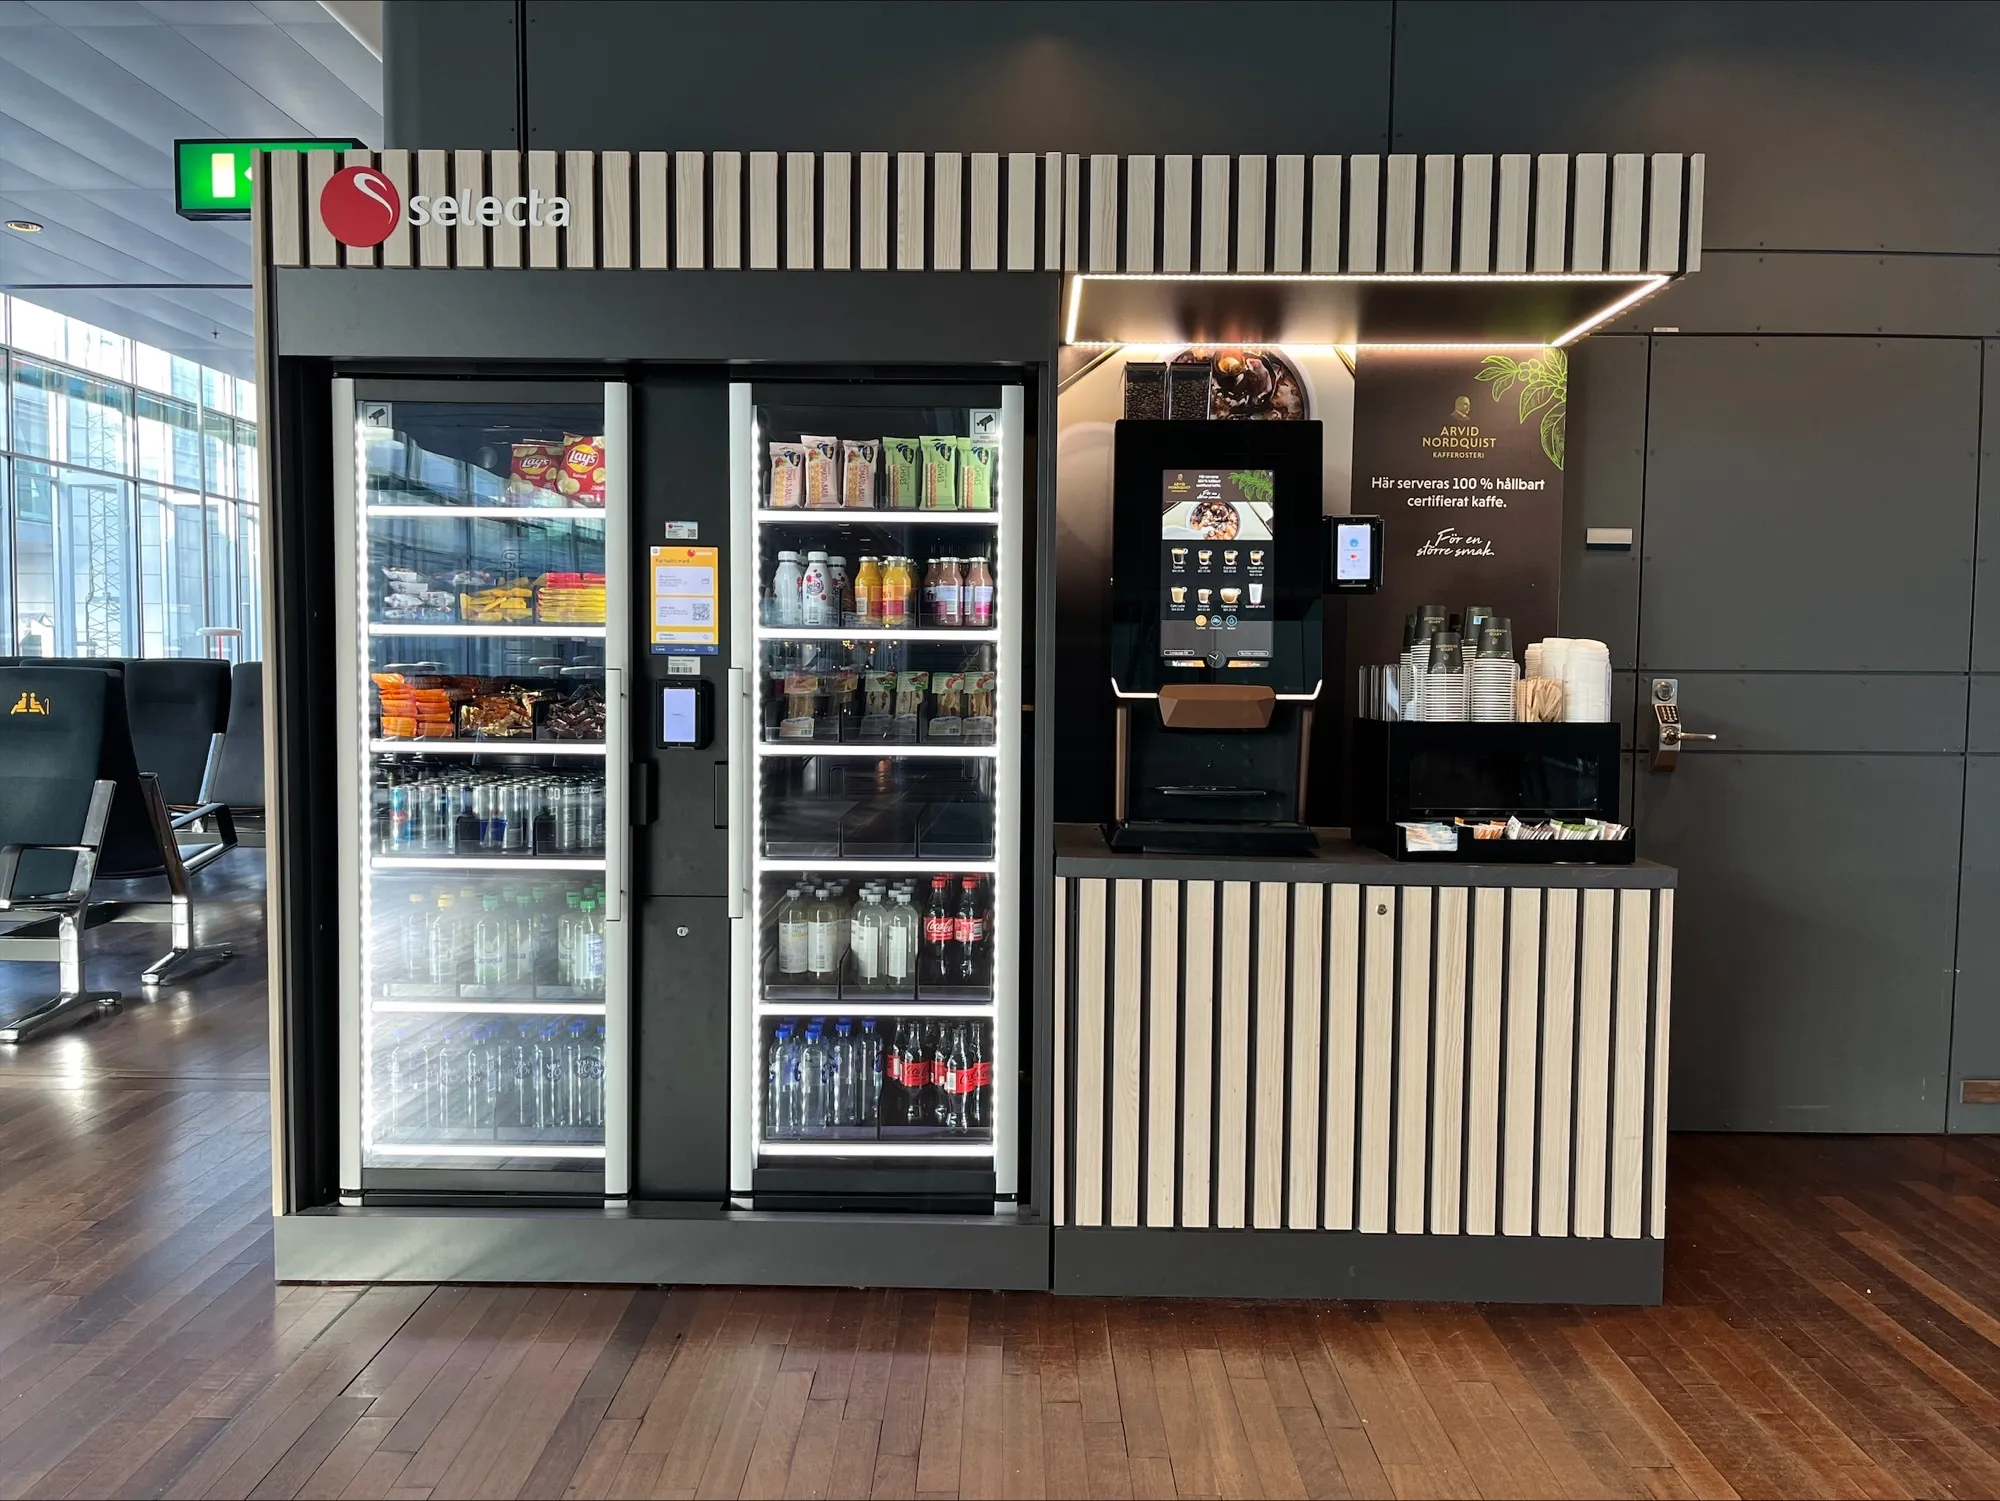 Logistics
Slow audit cycles slow down your entire operation
How automated inventory systems cut audit time from days to hours and improve supply visibility.
Read more →Stay informed
Get the latest on inventory automation, supply chain strategy, and workplace efficiency.
Ready to automate your physical supply?
Let’s discuss your operational challenges.